

Table of Contents
Narrow Range 4 and Narrow Range 7 (NR4 and NR7 Trading Strategy) – contraction and expansion technique
The NR4 and NR7 Trading Strategies assist us in locating stocks ahead of time so that we can prepare for and profit from impending stock movement. The market goes through regular contraction and expansion cycles, which is where the NR4 and NR7 Trading Strategies excel.
In this trade setup, you should patiently wait for the market to enter into contraction, which means for the range of the bars to narrow. When we see NR4 or NR7, we can expect a larger price movement and direction. It is a breakout and reversal pattern that aids in profit generation after a range.
What we cover here are
- what is NR4 and NR7 Trading Strategy
- How to find NR7 day?
- How to find NR4 day?
- NR4 and NR7 Trading Examples
Why will NR4 and NR7 Trading Strategy work?
Narrow Range Trading Strategy is a breakout based method that assumes that the price of the security trends up or down after a consolidation in a narrow range.
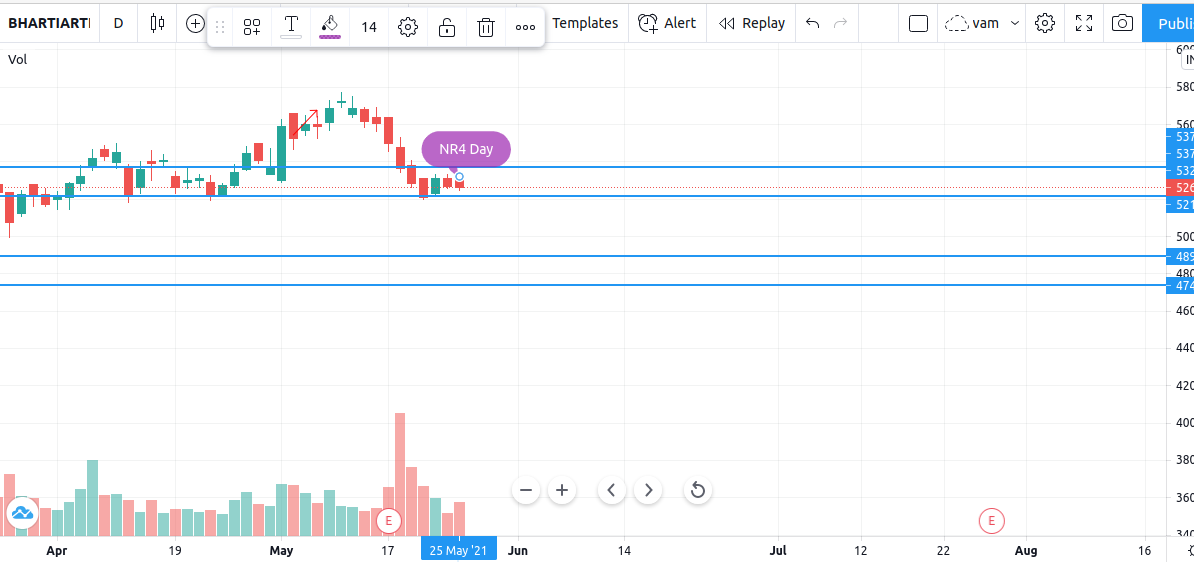
BHARTI AIRTEL Share on Daily timeframe marking NR4 candle with lowest range( high-low of four days compared) in last 4 candles.
The default period for NR7 is 7 days, which means that if the price range of any particular day is lowest when compared to the previous 7 days, that day is NR7. Similarly, the default period for NR4 is four days, which means that if the price range of any particular day is the lowest when compared to the previous four days, that day is an NR 4 day (Narrow Range 4).
The range is calculated as the difference between the day’s high and low. The day following the NR 7(Narrow Range 7) or NR 4 day serves as a confirmation day for where the price will move next. If the breakout occurs at the high of the NR 7 candle, it indicates bullishness, whereas if it occurs at the low of the NR 7 candle, it indicates bearishness. If the breakout occurs at the low of the NR 4 candle, it indicates a bearish trend.
The philosophy idea behind this pattern is same as the Bollinger Band Squeeze, a volatility contraction followed by a volatility expansion and contraction.
How to find NR7 day?
Following are steps to identify NR7 day:
- Get the high and low data of last few days
- Calculate the range for every day (high-low)
- Compare the range of today and previous 6 days range.
- If today’s range is the smallest of all the 7 days then it is NR 7 day else not.
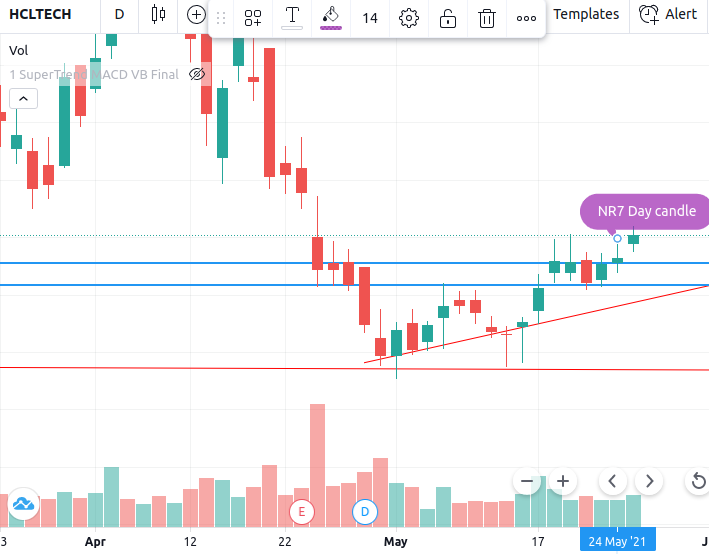
Daily timeframe marking NR7 candle with lowest range( high-low of four days compared) in last 7 candles.
How to find NR4 day?
Following are steps to identify NR4 day:
- Get the high and low data of last few days and then
- Calculate the range for every day (high-low)
- Compare the range of today and previous 3 days range (high-low).
- If today’s range is the smallest of all the 4 days before then it is NR 4 day else not.
The NR 4 day can be seen from the chart below:
Daily timeframe marking NR4 candle with lowest range( high-low of four days compared) in last 4 candles.

NR4 and NR7 Trading Example
The trading example above shows Bharti Airtel . We used Average True Range indicator which shows the range of the candles. We can see at the NR4 and NR 7 candle the ATR has decreased which means that the range of the candle is the lowest in the last 4 or 7 days.
A next day move above the high is bullish whereas below the low is bearish. NR 4 signal that breakout above high of previous day is bullish signal which is confirmed by the volume and also bullish candle on the next day.
We can see back to back NR 4 candle that generated a bearish candlestick pattern. One should sell when the price crosses at the low of NR 4 candle or may incur loss if the signal does not work out. At this candle we can also see that ATR has declined.
Narrow Range 4 and Narrow Range 7 give you a chance to be ahead of trade follower/indicator who can jump in the trend after you. One of the easiest ways to trade this setup is to go long above the Day’s high of NR7 or NR4 with a stop of the at the day’s low of the same.
You can go short below the Day’s low of NR7 or NR4 with a stop at the day’s high of NR7 or NR4 day.This pattern gives a trader a distinct edge to trade at least next 2-3 days. In many situations, NR 7 breakout is found near the beginning of new wave.
Main bullet points:
- Like bollinger band squeeze and expand, For NR7 the default period is 7 days, if the price range of any particular days is lowest as compared to last 7 days then that day is NR 7 day.
- Like bollinger band squeeze and expand, For NR4 the default period is 4 days, if the price range of any particular days is lowest as compared to last 4 days then that day is NR 4 day.
- One should buy only when previous candle is NR7 candle, and current candle has a Gap-Up opening.
- One should sell only when previous candle is NR7 candle, and current candle has a Gap-Down opening.
- Preferred timeframe for this setup is daily for scanning the stocks before hand like with Chartink.
Brief Points covered:
- nr4 and nr7 screener – chartink link will be provided
- nr7 excel formula – Excel sheet calculator will be provided
- nr4 strategy – as explained above buy above high of NR4 candle and sell below low of NR4 candle
- nr7 formula – as explained above range(high-low of each day compared to previous 3 days)
- nr7 strategy accuracy – 70% accuracy when placed together with trend.(trend is your friend)
- nr7 days intraday strategy- as explained above buy above high of NR4 candle and sell below low of NR4 candle
- nr7 stocks for tomorrow – Will providing stocks with NR4 and NR7 Candles and scanner link in Chartink
- nr7 strategy scanner – Chartink link will be provided here shotly.