
Table of Contents
Let get into depth of Volatility and Implied Volatility
Volatility measures the rate of price changes in an underlying asset, affecting options prices. Higher volatility leads to higher option premiums, as options based on volatile assets are more likely to be invested before expiration.
Low-volatile assets have tight price variation, indicating uncertainty in future asset prices. Options are only invested if underlying price is near strike price.
If an option is in the money, its premium may also include intrinsic value in addition to time value.
Just the time value of the option premium is impacted by volatility.
The length of time to expiry will determine how much volatility will effect option pricing; the shorter the time, the less impact volatility will have on the option premium because there is less time for the price of the underlying to shift dramatically before expiration.
Volatility changes can be more significant than stock price changes, even with short expiration dates. This can lead to a volatility crush, where the price of a call declines despite an increase in the underlying price. For example, SBIN’s call options were higher before earnings announcement, but later declined to less than 6.00.
Higher volatility increases the delta for out-of-the-money options and decreases it for in-the-money options, while lower volatility has the opposite effect. This relationship affects the probability of the option finishing in the money by expiration.
Implied Volatility is Not Volatility- It Measures the Demand /Supply of Option
Implied Volatility is Not Volatility- It Measures the Demand /Supply for a Particular Option.
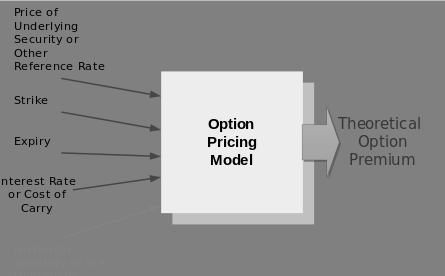
The Black-Scholes model of option pricing considers volatility, strike price, expiration time, interest rates, and dividends, all of which impact option prices, highlighting the influence of volatility.
When the market is active, the following factors are known:
- the actual option premium
- strike price
- time until expiration
- interest rates
- any dividend
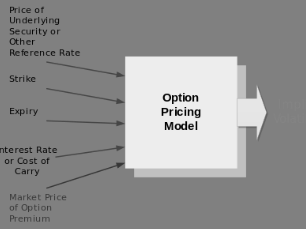
Volatility can be calculated using the Black-Scholes equation or another option-pricing model, and most platforms provide it for each option listed, eliminating the need for trader calculation.
Below gives the Theoretical Option Price
And below give the Implied Volatility IV Value of Option
Implied volatility, a standard deviation percentage, does not predict future stock price swings and can change rapidly without underlying asset volatility. It represents demand over supply for an option, not the underlying asset’s volatility.
In a rising market, calls have higher implied volatility, while puts have lower volatility. Conversely, in a declining market, puts have higher implied volatility.
The implied volatility of a call decreases the delta for in-the-money options due to increased chances of going out-of-the-money, while increasing it for out-of-the-money options increases the delta.
Implied volatility is the volatility calculated from the current market price of an option premium, not present or future volatility. Historical volatility indirectly affects the option premium’s price, but the connection is indirect. Implied volatility is directly affected by the current market price of the option premium, which is influenced by historical volatility.
The implied volatility of an option does not accurately represent the actual volatility of the underlying asset. This is evident when a trader wants to buy or sell a large number of options on a specific underlying asset, such as a pension fund. The large order directly influences the option’s pricing, but it does not affect the underlying asset’s price, as the buy or sell orders are for the option itself.
Implied volatility for puts, calls, and option contracts with different strike prices or expiration dates based on the same underlying asset will have different volatilities due to different options’ supply-demand equilibrium, causing a volatility skew and volatility smile, not a direct measure of the underlying asset’s volatility.
Implied volatility varies with the change in the supply-demand equilibrium for the option, which is why it measures the supply and demand for a particular option rather than the volatility of the underlying asset
Stock price increases can lead to higher implied volatility for calls, as demand for calls exceeds for puts, despite both being based on the same underlying asset. Puts on indexes, like the Nifty 50, may have higher implied volatility due to higher demand by fund managers. Fund managers may also sell calls on indexes to finance the purchase of puts, lowering calls’ implied volatility and increasing puts’s.
Implied volatility measures the demand-supply equilibrium and can indicate an option’s over- or under-pricedness based on other factors. However, it can be low if the option is unlikely to be in the money by expiration. If high due to an impending event, it will decline post-event, causing a volatility crush, where uncertainty is removed, indicating a rapid deflation of implied volatility. This is crucial for determining the option premium.
Implied volatility, a term referring to the fluctuation of supply and demand in an option, can be used to either increase profits or decrease losses, particularly in option spreads. High implied volatility may lead to option premium contraction, while low implied volatility may result from a temporary decline in demand or supply that may revert to the average later. High implied volatility tends to decline, while low implied volatility increases over the option lifetime.
Implied volatility is crucial when setting up option spreads, as maximum profits and losses are determined by the amount paid for long options and received for short options. To lower the debit for long spreads and increase the credit received for selling short spreads, strike prices for long options should have lower implied volatilities, while strike prices for short options should have higher volatilities.
Implied volatility varies among assets like stocks, indexes, and futures contracts. However, an index is less volatile than its underlying assets, as it measures price changes of all components, with assets with higher volatility offset by those with lower volatility.
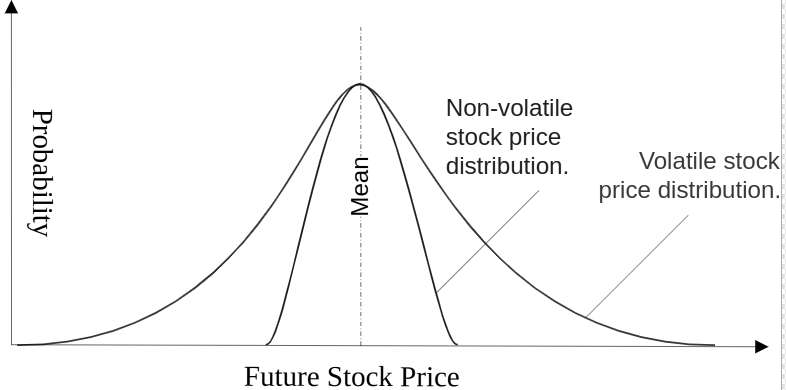
Diagram showing the difference in the expected price distribution about the mean for a volatile and a non-volatile stock.
Implied volatility is an annual standard deviation expressed as a percentage, used to compare the implied volatility of different options based on the same asset or different assets like stocks, indexes, or futures. Other factors like interest and dividends are also expressed as an annual percentage. Most trading platforms calculate implied volatility for different options.
The standard deviation is a statistical measure of an asset’s variability and volatility, which can predict its price range. In a normal distribution, 68.3% of price changes over a 1-year period are within 1 standard deviation of the mean, 95.4% within 2 standard deviations, and 99.7% within 3 standard deviations. The standard deviation’s width is determined by volatility. A narrower distribution indicates less variability, while a flatter distribution for highly variable assets shows wider variability in pricing over time.
Vega and Other Measures of Volatility
Vega is a measure of the change in the theoretical option price due to a 1-point change in implied volatility. For example, an option with a vega of 0.01 increases by 1 per contract for each point increase in volatility and loses 1 per contract for each 1% decline. In contrast, a 1-point increase in volatility decreases the short option’s value.
Options have both intrinsic value and time value, with intrinsic value indicating the amount in the money and time value calculating the option premium minus intrinsic value. Time value depends on the option’s probability of entering or staying in the money by expiration. Volatility only affects the time value of an option, with vega being the greatest when the time value is greatest and least when it is least. Time value is highest when the option is at the money, and as the option moves further out or into the money, so does vega.
The Chicago Board Option Exchange (CBOE) Volatility Index (VIX) measures implied volatility on options based on the S&P 50 index, not the underlying stocks. VIX, also known as a fear index, measures the amount of fear in the market, but it may cause fear rather than reflecting it due to higher fluctuations in supply and demand for options. Other measures of general volatility include the Nifty 50 Volatility Index , which measures the volatility of the Nifty 50, including high-tech companies.
Volatility Skew
The volatility skew of options varies with different strike prices, influenced by supply and demand. Forward skews have higher implied volatilities for higher strike prices, while reverse skews have lower implied volatilities for higher prices. A smiling skew increases for strike prices lower or higher than the underlying price, while a flat skew has no skew. Most underlying asset options have a reverse skew, as slightly out-of-the-money options have greater demand than those in the money. Additionally, out-of-the-money options have a higher time value, making volatility more significant for options with only time value. Thus, a call and put at the same strike price will have different implied volatilities, demonstrating that implied volatility is not the underlying asset’s volatility.
The volatility skew effect is a phenomenon where implied volatility depends solely on the option premium, rather than the underlying asset’s volatility, which remains constant across different strike prices and option types.
Options with identical strike prices but different expiration months show a skew, with near months showing higher implied volatility due to higher demand for near-term options over those with later expirations.
The above article is for educational purposes only and if any discrepancies contact us for making remedial actions…
Thank you.