
Table of Contents
Ltp calculator summary – Independent unbiased Review
Ok, i know the name of this tool can be little misleading atleast to me but what this tool is it gives are option chain view of NSE option chains for Nifty, BankNifty, FinNifty where the highest Volume, Open Interest, Change of Open Interest are all marked in colors easy to notice for spotting the resistance and supports of each index and where they might move based on which side they are weaker like up or down(price). WTT is Weaker towards Top (price may move up) and WTB is Weaker towards Bottom (Price may move down). No matter what people say, its not 100% (nothing is 100%) just need to follow the rules of game like having a trading psychology with best Risk Reward Ratio and Price Action. And remember never to gamble on positions. The moment you feel like you are gambling, you are inviting trouble to your life.
Chart of accuracy 1.0
LTP Calculator and its summary of how to take trades. In Simple words below- There are 9 scenarios explained in Ltp calculator in what is called Chart of accuracy 1.0.
Name ltp calculator can be misleading for few people but here is what is does. It’s shows key support and resistance areas on option chain where sellers/writers positions indicate the market sentiment. And shiting of position with change in oi field indicating where the shifting is happening. Volume is the public(number of public) involving in the trade where oi and oi change as writters positions where they bet huge money on these positions.
Apart from that it show a resistance and support based end points based the ltp of that option prices. (Whole thing of dot to dot reversal) knowing these levels can be helpful but keeping track of them(they keep changing) is a headache and also resistance and supports also keeps changing. Then there is concept of divergence where its kind of middle strike resistance and support levels to take trades.
Quick Tip to be successful:
Always look for best Risk Reward areas to trade instead of jumping right in the middle of a trend as market can reverse and hit stop loss. Say at a breakdown/breakout of a trendline or a Supply/Demand areas you get a good risk reward. Be first to take your stop loss if it comes and be last to book your profit(max profit). This best Risk Reward will improve your trading psychology to get most of the market.
Another Quick Tip:
Remember in a trending market you are major trend and minor trend (pull back or pull up) in a up or down trend. The major trend say its in Up trend then there will be some pull backs in between and these are a good place to join the trend of the index/Stock with best Risk Reward having stop loss just few points below the trendline.
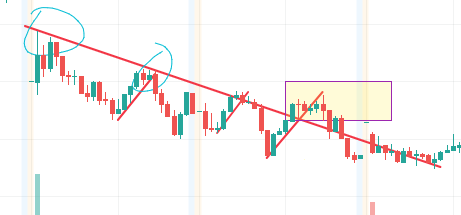
Below, its major trend has been down with after two points circled under dow theory/ Wycof theory making Lower Highs and Lower Low is in down trend. Now notice the red trendline breakout at the for smaller up trends in between, thats the best place to enter the market with best Risk Reward. If this coincides with LTP Calculator say WTB(Weak towards bottom) scenario with Support still good points away then if RR is 1:1.5 or higher then you can enter the trendline with stoploss not to close to trendline but just a few points away.
Below i have also marked a false breakout to give a idea as to not all breakouts work or nothing is 100%. If you have placed a stop loss correctly then you will be able to exit with minimum loss against a bigger loss which is very hard to digest.
Always think of probabilities that is
1. Market is in downtrend, so better to go with the trend.
2. What are major supply and demand zones where market may reverse.
3. Is there any supplementary informaation like LTP Calculator to support your trade which will improve odds of success.
Scenario 1 – Strong support with volume and open interest and Strong Resistance with volume and open interest then (Both side strong)
- Trade PE when on EOR, In other words for Nifty look for PE Entry when above Strong Resistance with 25 points up(say 19500 resistance then 19525 levels look for breakdown of trendline or something for PE Entry). For Banknifty its around 50 points.
- Trade CE when on EOS, In other words for Nifty look for CE Entry when above Strong Support with 25 points Down(say 19400 support then 19475 levels look for breakup of trendline or something for CE Entry). For Banknifty its around 50 points.
These will high probability trades but always use a proper stop loss.
Scenario 2 – Strong support with volume and open interest then
- WTT(weak towards top) take CE trade from EOS which is around 20 points away from support strike for nifty and around 40-50 points away for banknifty subtracting these to strike price. Say 19500 is strong support then take trade around 19475 levels for nifty. For Banknifty its around 40-50 points. (look for breakup of trendline or something for CE Entry).
These will high probability trades but always use a proper stop loss.
Scenario 3 – Strong support with volume and open interest then
- WTB (weak towards bottom) take PE from EOR towards support which is 20 or 40 points away from vol Or OI resistance that say 19500 is strong support and 19700 is vol resistance with 19600 WTB then take trade at 19680 for PE towards support of 19500.(look for breakdown of trendline or something for PE Entry). For Banknifty its around 50 points.
These will high probability trades but always use a proper stop loss.

Scenario 4 – Strong resistance with volume and open interest then
- WTT(weak towards top) take CE trade from EOS which is around 20 points away from support strike for nifty which can be volume support and around 40 points away for banknifty subtracting these to strike price. Say 19700 is strong resistance and support of volume at 19500 then take trade around 19520 levels for nifty towards up that CE. (look for breakup of trendline or something for CE Entry).
These will high probability trades but always use a proper stop loss.
Scenario 5 – Strong resistance with volume and open interest then
- WTB (weak towards bottom) take PE from EOR towards support which is 20/40 points away from strong resistance that say 19500 is volume support and 19700 is strong resistance and support of 19500 with 19400 WTB then take trade at 19680 for PE towards support.(look for breakdown of trendline or something for PE Entry)
These will high probability trades but always use a proper stop loss.
Scenario 6 – Both WTT
- Take CE from support from EOS or any good dip in price around demand areas. (look for breakup of trendline or something for CE Entry).
These will high probability trades but always use a proper stop loss.
Scenario 7 – Both WTB
- Take PE from resistance from EOR or any good rise in price around supply areas. (look for breakdown of trendline or something for PE Entry)
These will high probability trades but always use a proper stop loss.
Scenario 8 – Resistance WTT and Support WTB
- No Trade.
Scenario 9 – Resistance WTB and Support WTT
- No Trade.
Chart of accuracy 2.0
Here Put to call Side Open interest is analysed on each major support and resistance.
Say at a strong Resistance
- if Call OI increasing further with Put OI decreasing then that strike is strong resistance.
- if Call OI decreasing with Put OI increasing then that strike is losing its resistance and is ready to be broken.
Say at a strong Support
- if Put OI increasing further with Call OI decreasing then that strike is strong Support.
- if Put OI decreasing with Call OI increasing then that strike is losing its Support and is ready to be broken.