
Table of Contents
Candlesticks Basics:
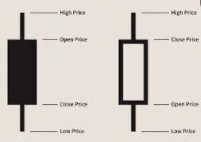
The body of a candle is the portion of the candle that extends from the open price to the closing price. White or green candles are used to indicate bullish sentiment when the close price is higher than the open price (C > 0). Bearish Candle forms when the close price is below the open price (C <O) which forms a black or red color candle and it signifies a bearish sentiment. The candle’s top and bottom indicate the high and low prices of the bar in the chart. In cases where the high or low exceeds candle’s body, there’s an wick called a “shadow” or “tail”.
The distance between the candle’s low and high is known as the range.
Candlesticks come in different shapes, sizes, and combinations.
Ability to quickly piece together the market’s response using this vital information will be extremely beneficial to your trading success.
Important Market Reversal Candlesticks :
The reversal Candles Setup is one of the most visually compelling candlestick patterns due to its long price tail, which helps to highlight major reversal opportunities in the market. These factors can be easily overlooked, even though this candle pattern is well-known and appears to be elementary. Considerations when looking at reverse-wick candlesticks include: the candle’s body, the candle’s size in relation to the body, and close percentage (the percentage of the candle’s price that closes relative to its range).


- The size of the reversal wick is determined by the size of the body.
- Ideally, a wick should be 2.5 to 3.5 times larger than the body.
- It’s also important that the bar’s close falls within 35 percent of the candle’s overall range for a bullish reversal wick.
- The candle must close within 35 percent of the overall range of the candle in order for it to have a bearish reversal wick.
- paired with pivot points these reversal candles can be extremely helpful
- On the basis of their placement in an overall trend, these candles are called hammer, hanging man or dragonfly doji in traditional candlestick terminology.
Secrets of a Pivot Boss Summary – Value Area, VAP, POC, Pivot Points, CPR by Frank ochoa
Using Previous Day Information
Why do we want to use a prior day’s information for the following session? We all know that the information is old news? But by understanding where the market perceived value to be fairest in the prior session, we are able to use this information to help us determine price valuation for the current session.
Volume at Price Information
Price-based, market-generated information is the sole source of information for the Money Zone.
Volume on the other hand, can have a significant impact on the market’s conviction and confidence.
If you’re looking for a similar indicator to Market Profile, try Volume at Price (VAP). Like the Market Profile, the volume at price indicator divides volume equally across all price points that were reached during a specific period of time and plots the information using a horizontal histogram directly on the price chart. The information display is actually quite attractive and allows you to quickly assess major points of interest.
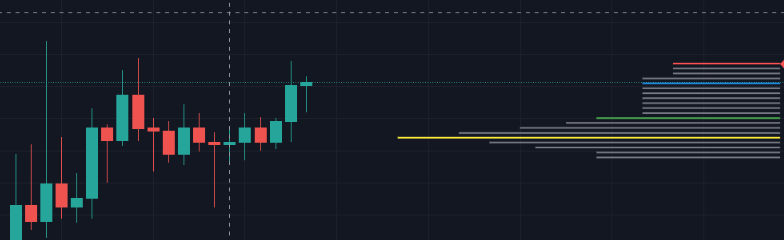
Using volume activity from a previous session, the VAP indicator overlays the histogram over the current price to give a visual representation of the volume activity at a particular price. On today’s chart, you can see the volume activity from yesterday at a certain price. If you look at yesterday’s market, you’ll see that volume point of control (VPOC) represents the fairest price as seen through the eyes of trading volume. Histograms show VPOC as the longest horizontal line in the session.
When it comes to fair value for traders, both the volume point of control and price-based POC identify the same price level. However, this is not always the case.
Point of Control
It’s important to remember that on any given day, a day’s point of control is where the most trading activity occurred. Due to this, buyers and sellers agree that this price is the most reasonable. Plotted on your charts is a point of control that provides insight into the market’s valuation trends. VWAP(Volume Weighted Average Price) can be used a a Point of Control indicator.
The Value Area
Traders will enter the market if they believe the price is over or undervalued. When it comes down to it, responsive buying and initiative selling occur at a lower value than responsive selling and initiative buying. Prices can be determined by looking at the value area. For a given period of time, 70 percent of trading activity occurred in the value area. Most trading activity took place within this range, establishing this area as a zone that facilitates trade easily and efficiently. Whenever you move outside of this range, you will trigger the actions of the participants who are receptive and initiative.
The outer limits of the value area serve as a sort of battleground between buyers and sellers. Vendors who are responsive and buyers who take initiative hang out at the VAH’s (Value Area Higher line) upper boundary. Market participants will look to start investing as soon as the price moves above this zone. However, the bottom part of the VAL’s (Value Area Lower Line) is where responsive buyers and initiative sellers will be looking to invest their funds.
The Value Area is a range of prices where the majority of trading volume took place on the prior trading day. In specific, this area is the range where 70% of the prior day’s volume happened. The value area is approximately one standard deviation above and below the average highest volume price. With this knowledge, there are specific probabilities of market behavior we can understand to digest the value area. The value area gives us an idea of where the smart money is playing ball and where the institutions are guiding the market. From this data, we can derive intra-day strategies that capitalize on market behavior.
The Market Open Relation to Value and Range
The opening of the market can have a significant impact on the day’s outcome.. Specifically, the open in relation to range and value can help you predict potential price behavior for the session.. Opening relationships can help you prepare for the day’s trading activity by validating or invalidating your price forecast. Examples include days where the opening price is at or near its value, as opposed to days where it is at or below the prior day’s price range, which will result in a markedly different conviction and result. Your ability to identify early market conviction will depend on your ability to recognize the pattern of the day.
The Three Opening Relationships
- In Range and In Value Acceptance/Rejection
- In Range and Out of Value Acceptance/Rejection
- Out of Range and Out of Value Acceptance/Rejection
It’s important to keep in mind that value acceptance or rejection is part of every relationship.
For example:
- if you’re trading within the previous day’s price range and value area, you’re opening a position in that range. A range and value open indicates that the market sentiment from the previous day has not changed and that the market is currently in balance. It means that the day’s risk and opportunity are low, which usually results in a quiet trading session. It is common for this type of opening relationship to lead to a typical day, trading range day, or sideways day.
- An open that occurs outside of the prior day’s value area, but within the prior day’s range, is the second type of opening relationship. Market sentiment has changed slightly, which means there is more risk and opportunity with an open in range but out of value. However, the market must break free of the previous day’s range and accept new value in order for greater directionality to be seen. An expanded typical day or a double-distribution trend day will likely occur if this is detected. As long as the market does not break out of the prior day’s range, Trading Range Day, or Sideways Day, will occur.
- That leaves us with an opening that occurs outside of yesterday’s range and value area. In such a case, the market has opened unbalanced, indicating that the market’s mood has changed significantly from the previous day’s market sentiment. That indicates the market is likely accepting new value and will likely continue to extend as more initiative participants join in, if the market does not fall back into the previous day’s trading range. A trend day, or a double-distribution trend day, is usually the result of such a connection. It is important to note, however, that if price returns to prior day’s range, this indicates that market participants were able to push the price back to the previous day’s value. This indicates that the breakout attempt was unsuccessful. It’s possible that a Trend Day in the opposite direction will occur if new value is strongly rejected.
Because 70% of the trading activity occurs in the value area each day, it is vital to understand the value area’s importance. Buyers and sellers agreed that this was the best place to do business, so the majority of the day’s transactions took place within this range. When it comes to market-generated information, the ability to understand the relationships between current and prior value areas is extremely crucial. Contrary to other indicators, Money Zone levels from the previous day are still very relevant in the marketplace for several days, if not weeks. This will help you to better understand the current market behavior and future price movements.
Value area relationships allow you to gauge market strength and prepare for specific types of setups during the day. When analyzing the current strength and direction of the market, seven types of value area relationships should be considered: Higher Value, Overlapping Higher Value, Lower Value, Overlapping Lower Value, Unchanged Value, Outside Value, and Inside Value. The direction of each value area relationship determines the expected outcome.
Entry Options:
For example, if there is a market opening, A gap above VAH indicates that the market is ready to reverse its trend, so look to buy a pullback to the value area or the point of control in anticipation of a bullish session. This will help you determine whether or not the market is accepting or rejecting your predicted directional bias.
Entry Options in a Bullish Trend
Open Above Value Buy at VAH and POC
Open Within Value Buy at POC and VAL
Open Below Value Sell at VAL and POC
Entry Options in a Bearish Trend
Open Below Value Sell at VAL and POC
Open Within Value Sell at POC and VAH
Open Above Value Buy at VAH and POC
Value Area Overlap:
You have an Outside Value Relationship (OVR) whenever your current value area is larger than your previous one. As a whole, buyers and sellers are satisfied with the trade facilitation in this area, but the previous session widened the range of options for better trade.
Inside Value relationship occurs when the current day’s value is completely absorbed by the prior day’s value area, forming an Inside Value relationship. This relationship usually indicates a low level of volatility before the current session. Instead of trading within a range on an outside value day, the inside value day suggests that the market was in balance, but is now poised for a big breakout.
Width of Money Zone or VAH and VAL
The width of the Money Zone value area can be a big determining factor on price movement if the range is abnormally wide or narrow .
Narrow Zone formation is indication of a new breakout possibility and Wide is indication of Sideways market.
Virgin Money Zone
A virgin Money Zone level can be an extremely important reference point, as market participants will usually drive price back toward this untouched level for a test at a future point in time.
VAP in Trending Markets:
VAP indicator allows you to buy the dips and sell the rips along with the market’s elite traders when the market is trading within a clearly established trend.
Professional traders on the other hand, will usually wait for a pullback before entering a trend. They buy when the price is at or below value, and they sell when the price is at or above value, according to the experts. Volume at price, in contrast to many other indicators, reflects real market activity at every price level throughout the course of a trading day. Price levels at, below or above value jump off the chart when these days are connected in a trend. We can notice “the Escalator Effect” when in trend with VAP since price uses volume at price as an escalator or
staircase to push itself to new highs or Lows.
I will provide some examples soon for better understanding…
Standard and Extended Floor Pivots Formula
R4 = R3+(R2-R1) (Extended Pivot)
R3 =R1 + (High – Low)
R2 = Pivot + (High – Low)
R1 = 2 x Pivot – Low
TC = (Pivot – BC) + Pivot (Extended Pivot)
Pivot = (High + Low + Close)/3
BC = (High + Low)/2 (Extended Pivot)
S1= 2 X Pivot – High
S2= Pivot – (High – Low)
S3 = S1 – (High – Low)
S4 = S3 – (S1 – S2)(Extended Pivot)
The Central Pivot Range (CPR) is absolutely, without a doubt, the most powerful part of the Floor Pivots indicator. The TC,BC and Pivot above constitute the CPR.
In Simple words using pivot points can be as simple as
“Buy at support in all uptrend and sell at resistance in a downtrend.” which is the standard formula of making money which is buy low and sell high.
Two-Day CPR Relationships
Higher Value Bullish
Overlapping Higher Value Moderately Bullish
Lower Value Bearish
Overlapping Lower Value Moderately Bearish
Unchanged value Sideways/Breakout
Outside Value Sideways
Inside Value Breakout
Each of these CPR relationships depend on two important prices which are
1. prior day’s closing price
2. the current day’s opening price
Where the market closes in relation to the pivot range gives you an initial directional bias for the following session. The next day’s opening price will either confirm or reject this bias, which then gives you a road map for which type of trade you should be prospecting.
Gap Trading
A gap at the open indicates that market sentiment has changed overnight and the market is all set to move in the current session.
Gap Trading is highly profitable in breakaway days using the pivots. CPR (central pivot range) can have an amazing magnetic affect on price that can lead to a high percentage fill of the morning gap.
The market’s equilibrium is determined by the central pivot range (CPR). Therefore, it can exert a powerful gravitational pull on the price, which is especially evident on days when the market opens with a gap. Once a gap has been filled, you can expect it to happen a lot more often than not if certain conditions are met. We can call this “the Magnet Trade” , because the CPR attracts price causing a filling of the gap between the two markets.
IT gives good profits in just few minutes of Session start after Gap Open.
For Detailed one to one Course on this whole syllabus contact us at admin@quick-hack.com
References:
- SECRETS OFA PIVOT Boss REVEALING PROVEN METHODS FOR PROFITING IN THE MARKET By FRANKLIN O. OCHOA, JR.
- CPR Strategy by Mr. GOMATHI SHANKAR.
Note: please note that above is my personal understanding/summary of my understanding of the book pivot boss. If any of the content does not seem correct, please point out in comments and will be corrected upon investigation. This is purely for education purposes only.