
Table of Contents
Central Pivot Range (CPR) Indicator – The best Indicator for trading
Pivot points are one of the most elementary yet powerful indicators used in Technical analysis for trading both for swing trading or Intraday. It is comprised of a pivot line surrounded by a series of support and resistance levels which helps in predicting the price movements in trends. There are different types of pivot points used by price action traders. The one main one is Central Pivot Range or CPR Indicator.
What is Central Pivot Range (CPR)?
Central Pivot Range is a versatile technical indicator usually comprising of 3 levels – a central pivot point (pivot), top central level (TC), and bottom central level (BC).
The calculation of the levels is very simple:
TC = (Pivot – BC) + Pivot

Pivot = (High + Low + Close)/3

BC = (High + Low)/2
TC = (Pivot – BC) + Pivot
Pivot = (High + Low + Close)/3
BC = (High + Low)/2
CPR is calculated using High, Low, and Close price on previous day. When you add CPR levels in a stock’s chart, TC is highest, the pivot is at the center and BC is the lowest level. But in downtrend, TC’s value may be lower than BC. Irrespective of the calculation, the highest of the 3 values is typically termed as TC and the lowest is BC.
The fundamental idea behind this indicator is that the particular day’s trading range captures everything about the market sentiment of that stock and hence this CPR range can be used to predict the price movement of the next day.
Now good thing is values do not change with timeframes on technical charts unlike other indicators etc. And these levels remain constant throughout the day.
This indicator was first introduced by Mark Fisher in this book “The Logical Trader”.
Frank Ochoa added another dimension, central pivot point to this indicator.
How does CPR differ from traditional Pivot Points?
The traditional pivot points generally have one central pivot line surrounded by support and resistance levels.
CPR indicator is available in
- cpr indicator in ________ – from available functions pick cpr
- cpr indicator in tradingview – from available functions pick cpr or for advanced use cpr indicator by Gomathi Shankar
- cpr indicator in upstox – pick function from chart
- cpr indicator in sharekhan – pick function from chart
- cpr indicator mt4 free download – will provide in coming days
- simple cpr indicator in tradingview – simply type cpr in available function on technical charts
- cpr indicator in angel broking – select the cpr indicator from functions
- how to add cpr indicator in upstox – select the cpr indicator from functions

Traditional Pivot Points
CPR consists of 3 levels, a central pivot point (pivot), top central level (TC), and bottom central level (BC). Surrounding these are 3 levels are the usual support and resistance lines
Now there are many trading strategies for CPR like for wide range CPR below :
- If you trade based on CPR breakout with volume confirmation, the success rate can be as high as 70%.
- Don’t forget to put a stop loss to save your capital from unexpected moves.
- Can use one of the CPR levels as a stop loss.
- If you BUY as stock based on TC breakout, then the BC line can be your stoploss. If the CPR width is very narrow you can even look at the previous day’s CPR levels as a stop loss.
Second one used widely CPR like for narrow range CPR below with previous day high and R1 or previous day low or S1 breakout:
- If you trade based on Narrow CPR breakout strategy then with volume confirmation wait for previous day high and R1 or previous day low or S1 breakout, the success rate can be as high as 75%.
- Don’t forget to put a stop loss to save your capital from unexpected moves which can CPR if not more than 1% or half R1 to CPR on buy side and half S1 to CPR on sell side.
- Can use one of the CPR levels as a stop loss if not too far from R1 or S1 for buy and sell respectively
- If you BUY as stock based on previous day high and R1 then targets 1,2 would be R2 and R3. If SELL on previous day low or S1 breakout , then targets 1,2 would be S2 and S3 respectively. If the CPR width is very narrow you can even look at the previous day’s CPR levels as a stop loss.
CPR Interpretation – How to use it for Trading?
There are a variety of ways you can use CPR indicator for your trading decisions. Blow we have summarized the important ones:
CPR Breakout
Any breakout above or below the TC and BC lines respectively indicates a high probability that the movement will continue. And if the breakout candle has higher volume than the preceding candles, than it gives an extra confirmation for price movement.
CPR Width
The width of the CPR lines very accurately gives an idea of the expected price movement. If CPR width is narrow, that is the distance between TC and BC lines of CPR is very low, then it indicates a trending market.
While if the distance between TC and BC lines is relatively higher it indicates sideways market.
CPR as Support and Resistance
CPR lines can also act as support and resistance. CPR can help you decide your stop loss level. Any of the 3 CPR lines can be used for this purpose.
Interpreting overall trend through CPR
- If the CPR lines form higher high every day and look like an upward ladder, then it indicates strong bullishness.
- if the CPR formation is like a downward ladder, then the market is probably bearishness.
Virgin CPR
If the price levels for a particular timeframe do not touch the CPR levels of the same timeframe, then that CPR is known as Virgin CPR.
Look at the below chart example where blue dotted lines indicate CPR levels, and none of the price candles touch these levels.
Virgin CPR Indicator
There is a 30-40% probability that the price would not touch the CPR levels for a given day
Virgin CPR can be used as very strong support or resistance level.
Trade using Virgin CPR Indicator
Virgin CPR levels of the previous day acts like a very strong support or resistance point. So, if the price touches the previous day’s virgin CPR level, it may bounce back very sharply in the opposite direction.
What is CPR used for?
CPR levels are calculated based on the daily timeframe and used in an intraday timeframe.
CPR indicator works equally well in higher timeframes also. If you trade on the Daily timeframe, then CPR should be calculated based on weekly price levels…. etc..
So in short, The CPR is calculated on a timeframe higher than where it is used for trading.
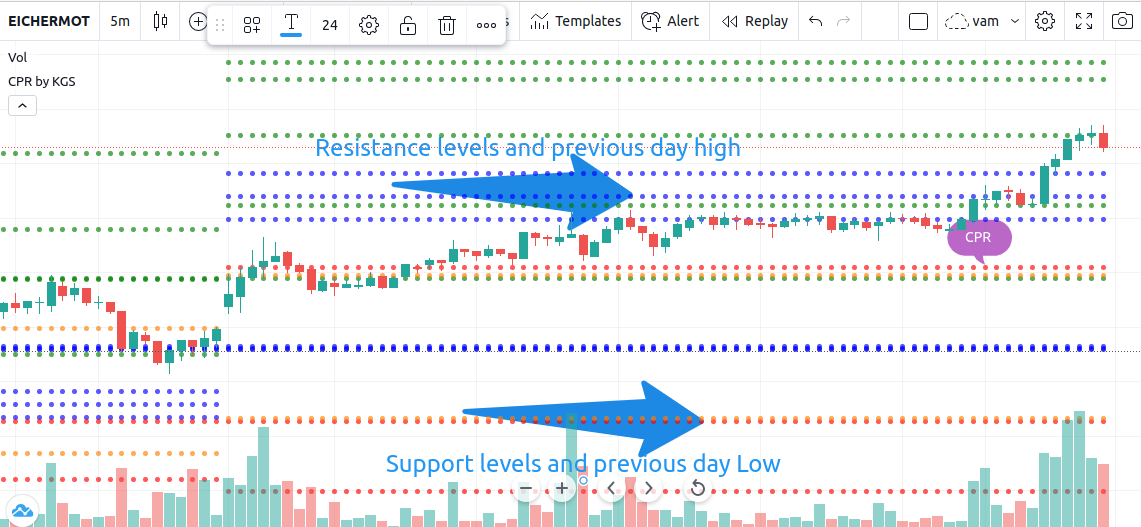
CPR Indicator in TradingView Charts
There are several versions of the CPR indicator available in TradingView currently. The one that we would recommend is Pivot Points CPR with M, W, D High Low by GomathiShankar.
Please note that it is not a built-in indicator present in Trading View, it is available in the public library free of cost.
CPR Indicator Accuracy for Intraday Trading
We found the CPR indicator to be highly accurate in the intraday timeframe. It’s recommended to use it in a 5-minute chart for high beta stocks or indices.
Like everything else in technical analysis, CPR also is not a 100% win but has higher probability of success when traded properly. You can succeed with proper position sizing and risk management.