
SUPPLY AND DEMAND
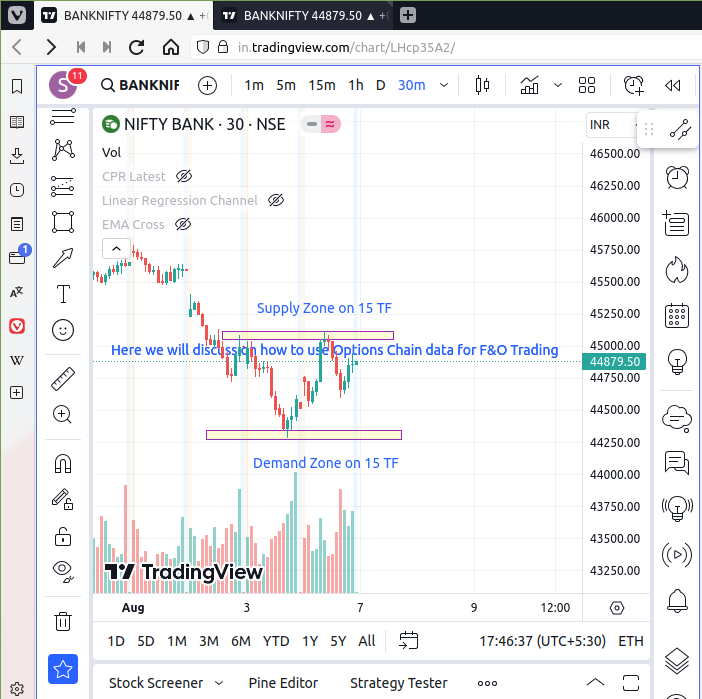
Supply and Demand zones do offer a great insights into the structure of any market. If you have an idea of how to trade with support and resistance zones, you might find supply and demand zones very similar.
WHAT IS A SUPPLY ZONE
Supply zones could also be defined as an active resistance level or a place where traders are selling huge amounts.
These levels are more broad than a resistance line. They are very similar to resistance zones.
WHAT IS A DEMAND ZONE
A demand zone is a broad area of support. It is also a level concentrated in buyers.
PRICE ACTION AND SUPPLY AND DEMAND ZONES
Another characteristic of supply and demand zones is the quick price action. As pointed out above, price action is very fast around those levels, so if there are opportunities they are quickly absorbed.
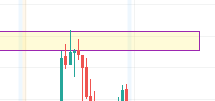
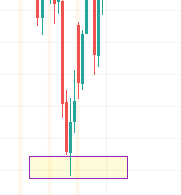
SUPPLY ZONE EXAMPLE and DEMAND ZONE EXAMPLE
SUPPLY AND DEMAND AND CANDLESTICKS
A very important element of supply and demand trading is the use of candlestick charts in conjunction with it.
The two most important candlestick patterns used in conjunction with supply and demand levels are the pinbar and
the engulfing pattern. The majority of traders using supply and demand zones will be looking for rejections or confirmations of
these levels.
Let’s have a look at a few examples:
DEMAND ZONE VS. PIN BAR/ENGULFING
SUPPLY ZONE VS INSIDE BAR SETUP
DEMAND ZONE VS ENGULFING/2-CANDLE ENGULFING
SUPPLY ZONE VS. INSIDE BAR
TYPES OF SUPPLY AND DEMAND
I will walk you through 4 types of supply and demand zones below
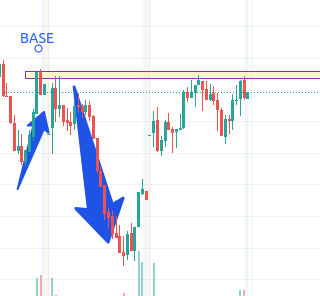
DEMAND TYPE 1
Down Base Rally(DBR)
In the first one on the left, we have price going down (D), then forming a base (B) and then going up Rally (R) again. I will call this setup the DBR setup.

DEMAND TYPE 2
Rally Base Rally(RBR)
In this type, there is an uptrend (R) first. Then, we have the price forming a base (B) after which we have a continuation of the uptrend Rally(R). I will call this setup RBR.

SUPPLY TYPE 1 (RBD)
In this pattern we have the prices going up Rally(R), then forming a base (B) and then going down (D). I will call this the RBD setup.
SUPPLY TYPE 2 (DBD)
In this last type of supply zone, we have price going down (D), then forming a base (B) and after that it continues its fall down (D). This is the DBD setup.

HOW TO IDENTIFY SUPPLY AND DEMAND ZONES
So, how to identify those 4 major types of supply and demand formations. As pointed out above, you need to follow the following three steps in order to identify the supply and demand zones.
1) Look at the chart and try to spot successive large successive candles.
2) Establish the base
3) Draw the zone
IMPORTANT NOTE
As already outlined, it is hard to draw a precise zone- it takes time and practice to be able to spot those areas. What you need to do is just follow the rules and practice enough until you feel confident in drawing these levels.
Don’t forget that this is how everyone else using those levels successfully has learnt it. After a while, it will become natural and you will be able to spot them quickly. I will also walk you through enough examples,
so to make your lives easier.
EXAMPLE ENTRY, STOP LOSS AND TAKE PROFIT
For the sake of showing those levels, let’s first use an example:
ENTRY, STOP LOSS AND TAKE PROFIT
In the image above, you can see the supply and demand trading rules. This is just one way you can trade with supply and demand zones. Different traders will have different rules, but what is important here is that you should always be aiming at higher rewards than the risks taken.
In the example above, the ratio is 1:3. The entry is usually the middle of the supply or demand zone. The stop is usually 5-10 pips below the demand zone, as indicated by the red line. Your target should be at least 2x or 3x your risk (as indicated by the image above). More on the exact rules of the trading strategy will be given later in this course.
Now just try to get the concept itself first.
EXAMPLE OF SUPPLY AND DEMAND
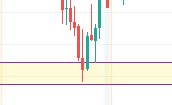
EXAMPLE OF DEMAND BEAR TRAPS WITH SUPPLY ZONES
First of all, what is a bear trap? Bear traps are nothing more or less but a failed second low. As the image to the left shows, after a second low, the price does not go any further, but starts a sharp climb upwards.
I am using bear traps a lot
GLIMPSE AT WHAT I AM LOOKING FOR WHEN TRADING WITH SUPPLY AND DEMAND ZONES
What I am usually looking for when using supply and demand in my trading is a bear trap below a demand zone.
This is probably one of the strongest patterns in trading that combines price action and supply and demand zones.
It is an area where a lot of stops and limits are hit and that is what makes it so powerful. It is also an area of an
equilibrium that attracts more interest than any other area in trading.
SOME CONCLUDING WORDS
As with anything else, supply and demand zones have their cons, as well. There is no perfect trading strategy or tool. What makes a difference along the way is your attitude towards trading.
A few are the most crucial things beginner traders need to pay more attention to:
1) Proper trading education
2) Trading practice (preferably on a Paper Trading account first)
3) Trading discipline
4) Sticking to your rules in good and bad days
5) Open mind
Being able to tick those 5 boxes will give you more freedom than you can imagine. Let’s now proceed to the real part of this trading course in next Part Applications of Supply and Demand zones