
Table of Contents
Stop getting stopped out of trades by stoploss hunting with ATR
There no worse feeling than setting a stop loss, entering a position, and having the market hit it before moving in your chosen direction. I’ve been there, and it is one of the most upsetting things that can happen in trading. In the long run, it will substantially impact your profitability and confidence in your plays. Here lets see to a better stop loss by taking one of the most important aspects of trading into account of volatility.
What is wrong with a fixed stop loss percentage or rough calculation?
Using a fixed stop loss like 10–20% for a asset is dangerous because volatility is different across different assets. You cannot compare the volatility of a stock as its different for each stock and keeps changing all the time. While a fixed 10 percent stop loss could work great for gold sometimes, which has pretty minor price fluctuations and can blow through it in minutes. This is inherently the problem with setting a fixed stop loss, it does not factor in the volatility of the asset. The best way to think about this indicator is that essentially it’s a 14 day moving average of price volatility in an asset.
What is the ATR indicator?
The Average True Range (ATR) is a volatility indicator that shows how much an asset moves, on average, during a given time frame. It is calculated by taking the greatest value of three calculations:
Current high minus the current low
The absolute value of the current high minus the previous close.
The absolute value of the current low minus the previous close.
Simply put, a stock experiencing a high level of volatility has a higher ATR, and a low volatility stock has a lower ATR. The indicator moves up and down as price moves in an asset become larger or smaller. A new ATR reading is calculated as each time period passes (1m, 5m, 1H, 1D, etc.). The values are stored for each period and then an average is taken, typically the average is taken based on 14 periods.
How to use the ATR to set a good stop loss?
Example of below stock for taking a long position after a struggle at a price point POC which is also now support/resistance and how to set a stop loss using the ATR.
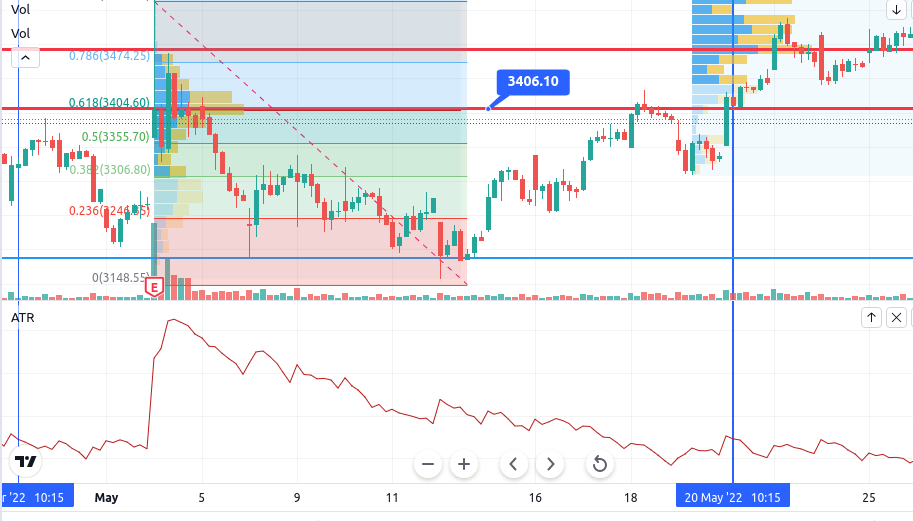
ATR here is showing 35 which will be taken as stop loss to account for volatility. Target will likely be double that with Risk Reward ratio of 1:2 or above with trailing stop loss to move along the trend.
Record the ATR value and adjust your stop loss using a multiple of it or just with little/minute buffer on it. If you are shorting, add the ATR to your stop loss. If your are going long, subtract the ATR value from your stop loss. Pick a multiple based on your personal risk tolerance. I am personally more conservative, so I do 1x the ATR value. Look what happens with our adjusted stop loss:
We see that the above ATR value is (35) since we are going long we substract the value to our chosen stop loss to get a new stop loss value of this. This way we survive the fake-out and don’t get stopped out of the bounce down. This allows us to catch the full move up.
Conclusion
From the example above we see why taking the volatility of an asset into consideration when we are setting a stop loss is a good idea. It can solve a lot of headaches and frustrations we would normally get using a fixed stop loss. There are other uses of the ATR like measuring trend strength or finding market reversals that I can cover in a later in another post if requested in comments. If you have any comments or questions regarding the indicator, comment them below and I will do my best to answer them.
Good luck….
Thank you for reading, please and share to help others find it.