
Option buying or Option selling using Option Chain data
Here we will discuss on how to use Options Chain data for F&O Trading
Option Buying Strategy using Option Chain Resistance and support with 60-70% accuracy and RR 1:1.25 minimum.
A simple intraday trading setup based on the Option Chain analysis technique. The chart timeframe for this intraday strategy is 5 minutes.
Using this configuration, you can trade equities and indexes that are a part of the derivatives market. Additionally, you can trade it using any instrument, such as cash (equity shares), futures, or options. Additionally, you can trade using this method in both bullish and negative markets.
To locate areas of resistance or support, we will use the Option Chain, and we will confirm our research using a candlestick pattern before placing a trade. As a result, this trading technique will combine the Option Chain and the Candlestick pattern.
Traders frequently examine the option chain as writers (sellers) data. Writers of puts are bullish, while writers of calls are pessimistic. The trend is most likely to be bullish if put writers outnumber call writers.
The strike price with the largest number in the call side open interest column and the change in open interest column shows the presence of call writers in that particular strike price, indicating that the call writers do not anticipate the price to rise over that specific strike price. At that strike price, the call writers have established resistance.
The strike price with the largest number in the put side open interest column and a change in open interest column shows the existence of put writers in that particular strike price, which means the put writers do not anticipate the price to fall below that strike price. At that strike price, the put writers have established support.
Option Chain will be used in this article for finding option sellers point of view of where the market is headed and what is possible support and resistance of the index.
Steps of the setup today would be:
We’re analysing the Nifty spot chart in the example below.
Step 1: We have to look for resistance using the option chain in the live market. As mentioned above, we have to see the strike price with the highest figure on the call side open interest column and change in the open interest column.
Let’s move to Step 1 analysis with the help of an example.
We use nseindia.com for option chain analysis. The above data gets updated every 5 mins in the live market. The above option chain data is of Nifty 3rd August expiry on 31 July date.
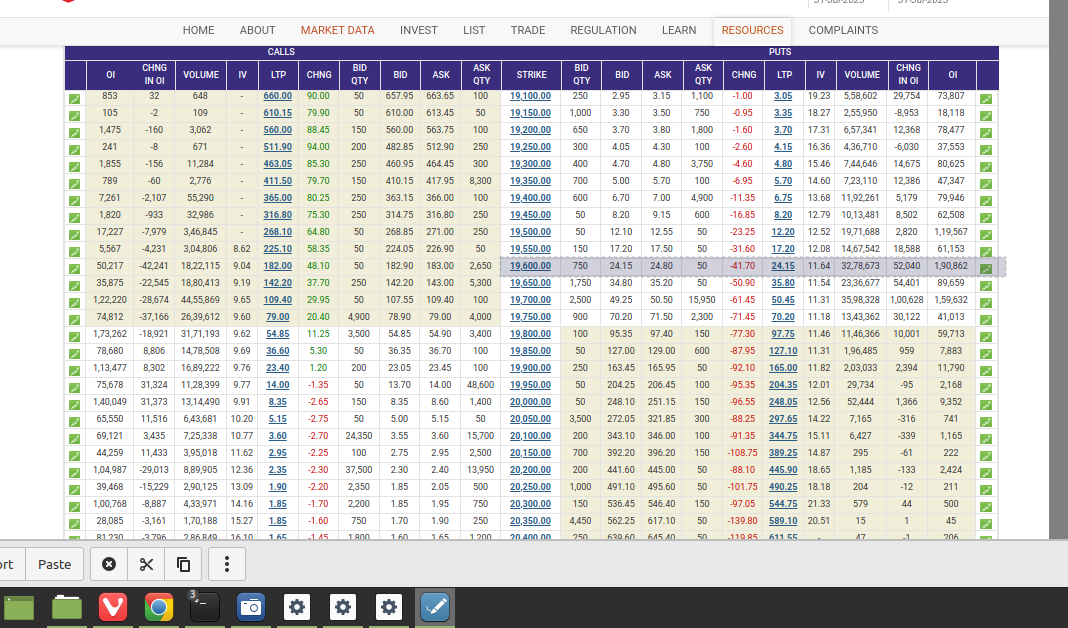
The first column is the OI(Open Interest) column and the second column is the Change in OI (Change in Open Interest) column. We can clearly see that the 19600 strike price (marked in a black box) has the highest open interest on put side and change in open interest. This indicates that put writers are creating positions at this specific strike price and don’t want the Nifty to go below 19600.
Now, we will look at the price charts and look for some bearish patterns(both price and candlestick) near 19600.
Step 2. We will look at the Nifty spot 22nd September 5 minutes chart and look for a bearish candlestick pattern near 19600.
In the chart above we can see the price kept moving down and then it came near 19600-19610 zones marked in yellow box. It also formed a rejection price action pattern where price rejects from a particular zone.
Or we can also prefer a trendline breakout of a LTF(1 min timeframe around the 19600 towards upside for entry.

Here we see a nice hammer type pattern with clean rejections from this 19600 levels which confirms that the price can take support at 19600 and go up.
Step 3 : Let’s understand with the help of a chart as to what price do we enter, where do we keep our stop loss and when do we exit (target)
Since it’s an intraday and a quick trade, the timeframe being 5 minutes, we will aim for a risk to reward of 1:1.25 or 1:2 RR. In our example the risk being 20 points, we will aim for a target of 30-50 points from our entry price which comes to 19654.
Once our price hits 19654, we will exit our 19600 call option position and come out with our profit.
Remember in market the fear of missing out and greed of getting more are two important things to keep in check.
If we want to ride the profits then its best to close all positions in profits at 19656-19660 levels except one lot with stop loss to cost price and then trial the stop loss every 30 points.
Option selling can also be done same way by selling 19600 PE strike price or going to 19500 PE strike price with stop loss fixed with around 30 points or 15 rupees and gain with 60 points or 30 rupees approx with 1:2 RR ratio. Please make sure you have a proper stop loss in place.
We hope this Option Chain technique strategy was simple and easy to understand.
We hope this was fun. This post is for educational purposes only…