
RULES OF THE GAME IN TRADING SUPPLY AND DEMAND TRADING
After all the examples given, time has arrived to give you the exact rules of how I trade with supply and demand zones. By now you should have realised that I use the bull/bear trap as an additional confirmation. Let’s see how to below
THREE BOXES TO TICK FOR A SUPPLY ZONE
3 MAJOR RULES FOR SUPPLY ZONE
As you can see from the screenshot above, there are 3 major rules that you should follow before you commit to a trade.
They are:
- There is an established supply zone
- Price breaks above it and forms a bull trap ( in other words induction/stop loss hunt)
- Price action pattern in the form of a bearish engulfing, inverted pin bar or an inside bar (these are the most widespread but certainly not the only 3 candlesticks that might form to confirm a trade)
THREE BOXES TO TICK FOR A DEMAND ZONE
3 MAJOR RULES FOR DEMAND ZONE
As you can see from the screenshot above, there are 3 major rules that you should follow before you commit to a trade.
They are:
- There is an established demand zone
- Price breaks below it and forms a bear trap ( in other words induction/stop loss hunt)
- Price action pattern in the form of a bullish engulfing, pin bar or an inside bar (these are the most widespread but certainly not the only 3 candlesticks that might form to confirm a trade)
TIMEFRAMES
Although supply and demand zones work best at higher timeframes, that does not mean that they cannot be applied on the lower timeframes. The best combination of timeframes for me is a Daily and 4H charts. I am getting the initial call from the Daily and
then the confirmation one from the 4H chart. I feel most comfortable with these two timeframes, but have seen traders using
successfully supply and demand zones on timeframes from minute chart.
It works on 5 minute charts to the 60 Minute to Day TF or Week TF. But rules need to be followed to see a proper rejection around the zones as Supply or Demand Zones do tend to become weak over time and breakout. So we need to be careful and need to see a proper rejection candles.
TIMEFRAME FOR TRADING for SWING TRADING DAY TF
THE 4H CHART
When the 3 rules from above are confirmed, I do turn my attention to the 4H chart, where I am looking for a second price action confirmation for an entry. This again comes in the form of a candlestick (price action) confirmation. Once such arrives, I am taking a trade. Simple!
Final notes to the rules of entry:
1) Check the daily chart for a supply/demand zone
2) Price forms a bull/bear trap on the daily chart
3) Candlestick confirmation on the daily chart
4) Candlestick confirmation on the 4H chart and entry
THE 4H CHART…
I must say that if I am using just the 4 hour time frame, I might end up in quite a few losing positions.
The way you should approach that scenario is start from the daily (higher) time frame. Once you have a signal there, then and only then you should go to a lower time frame.
MULTI TIMEFRAME APPROACH.
Finding Demand and Supply zones on higher timeframes and then taking entries on rejection based on lower timeframe.
CONCLUDING POINTS
Make sure you follow those rules rigorously in order to cut losers fast, because that is what we are aiming at for. You don’t want to stick to a position that is losing from the very beginning. You should be very flexible in your approach and cut your position
once you see that it is not performing as expected.
A very helpful method I am using is having a trading diary at hand and putting all my trades inside. An example of what it looks like is given below:
TRADING DIARY TEMPLATE IS A GOOD PRACTICE
it must outline trades, reason for entries, success or stop loss. what mistakes if any done.
TRADING DIARY TEMPLATE EXPLAINED
TRADING DIARY
You should have your own diary and write the reasons why you took a certain trade and why you exited it. In time, you would realise how useful it is. Coming back to your diary’s notes is a great way to learn and to realise where you are failing most. Is it that you are exiting a profitable trade too early, or that you are entering before you have a confirmation of a signal. All in all,
this is a great tool to improve your performance and in the end, it is all about becoming a better trader.
TRADING EXAMPLE 1 DAILY
TRADING EXAMPLES
4H EXPLANATORY NOTES
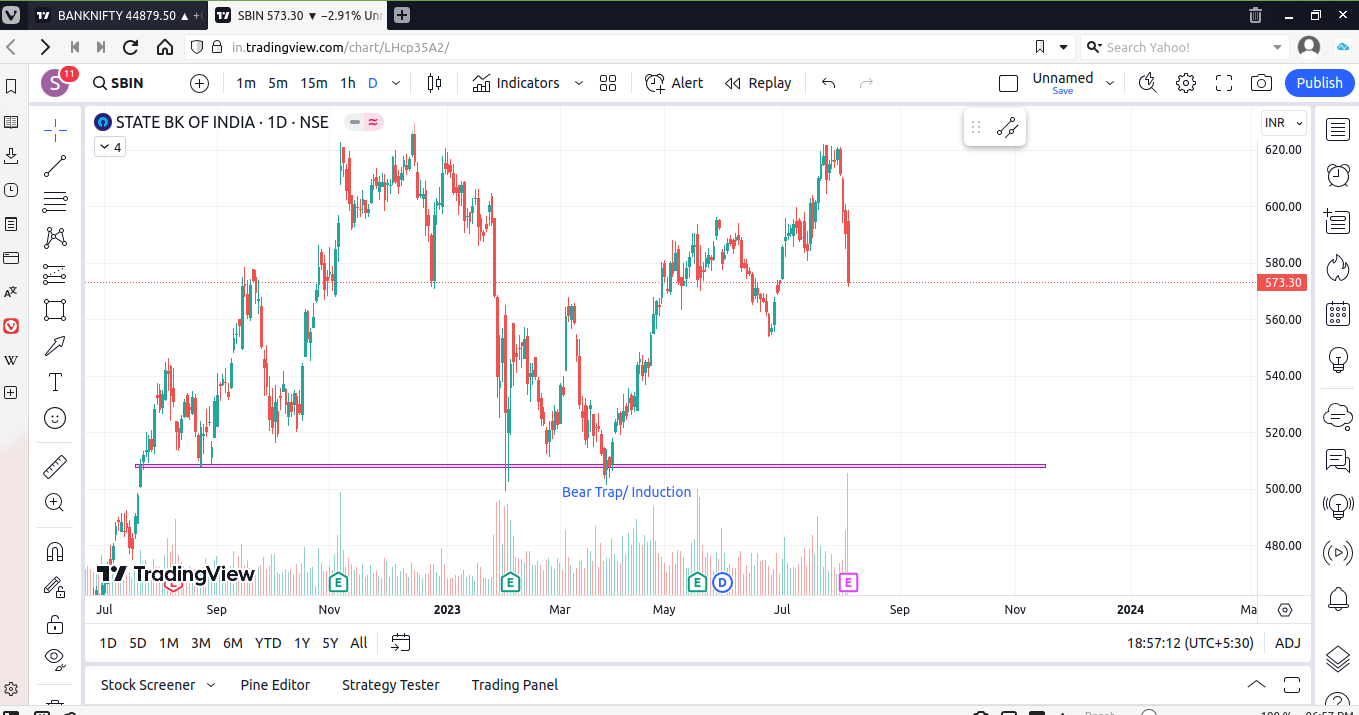
As you can see from the example below SBIN Share, there was a demand zone as marked by the yellow rectangle.
Second, there was a price action confirmation on the daily chart in the form of a two-day bullish engulfing pattern after a bear trap was formed on the daily chart.
Then lastly, you could see from the 4H chart that there was a “two-day” bullish engulfing pattern and also a bullish engulfing that appeared a few sessions later.
There note a bear trap here with induction after which prices moves up like 15% in matter of around 2.5 months.
These could have been ideal places to enter into a trade.
EXPLANATORY NOTES
Let me zoom into that 4H chart, so you can see more clearly:
bullish engulf
2-day bullish engulf

TRADING EXAMPLE 2 4H and then 1 HR ENTRY
TRADING EXAMPLES 4H
ENTRY ON 1HR TF

EXPLANATORY NOTES
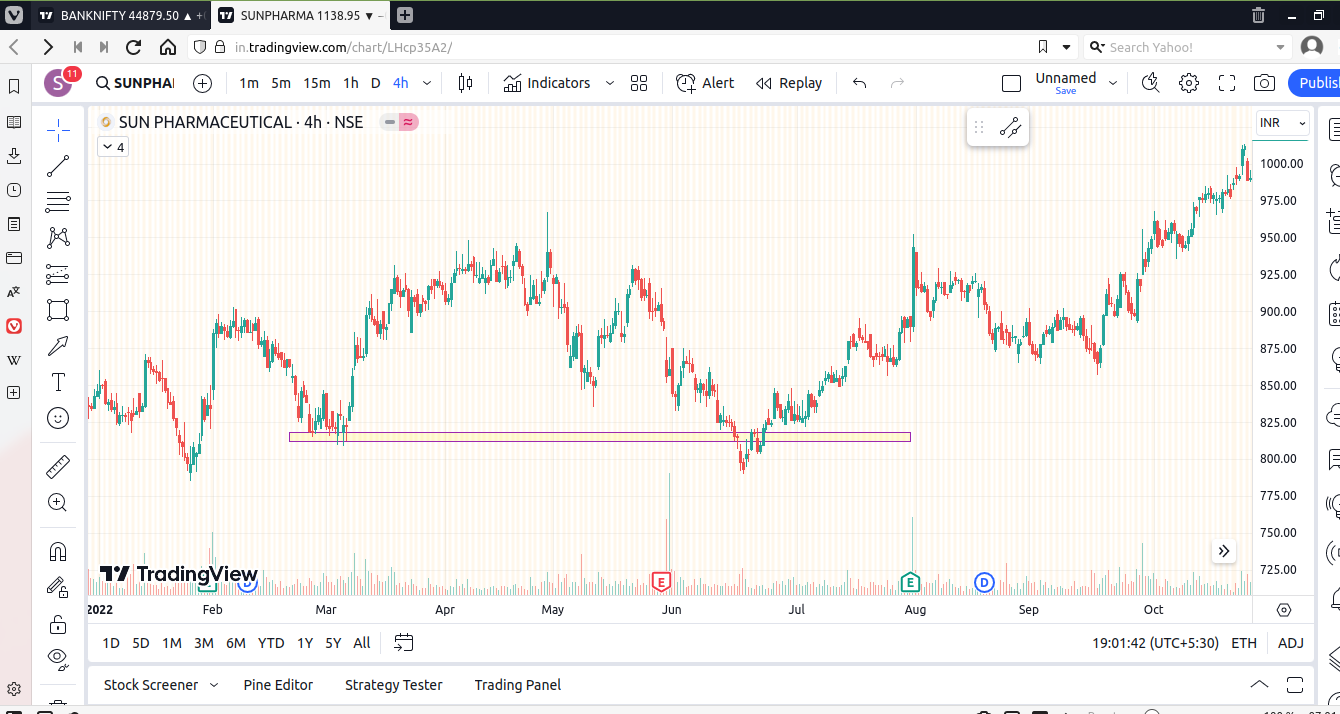
In the example above, there is a demand zone on Sunpharma and a bear trap that formed in the mid of June. A two-day bullish engulfing pattern formed on the 4H chart. The 4-hour chart printed a bullish engulfing pattern and a few sessions later an inside bar. Price action on the lower timeframes once again confirmed price action from the higher timeframes and
gave a great start of an uptrend.
TRADING EXAMPLE 3 2 HR
TRADING EXAMPLES 2H and 15 MIN ENTRY

15 min TF

EXPLANATORY NOTES
The example above is a text-book example. There is a major demand zone formed on the 2HR. There is a price action confirmation in the form of a bullish engulfing pattern which did not take long to attract a lot of traders and only a few sessions later pushed price much lower. On the 2H chart we can see initially an inside bar. It was followed by a small bullish engulfing pattern and later on by another bullish engulfing pattern. This led to a major reversal in the price of ALKEM Share.