
SUPPLY AND DEMAND EXPANDED
THREE STRENGTHS OF SUPPLY
STRONG SUPPLY
The stronger the supply level, the faster and longer the move will be. In the 3 examples above, you might see the 3 types of supply- strong, medium and weak.
The length of the candles is biggest when supply is strongest and vice versa.
THREE STRENGTHS OF DEMAND
STRONG DEMAND
The stronger the demand level, the faster and longer the move will be. In the 3 examples above, you might see the 3 types of demand- strong, medium and weak.
The length of the candles is biggest when demand is strongest and vice versa.

RETRACEMENTS
The rule of a thumb rule say that the more times a supply or demand zone has been touched the weaker it gets.
I.e. if a demand/supply level has been touched more than two times, it will be weaker and therefore a breakout is more
likely.
STRONG VS. WEAK DEMAND ZONE Vs.STRONG VS. WEAK DEMAND ZONE
As you can see from the two examples above, we have a strong and a weak demand zone.
The first example on top is showing how demand is becoming weaker in time, since it has been touched 4 times and on the fifth there is a breakout to the downside.
The second example on the bottom is showing how demand is still holding strong and is pushing the price higher. Price has touched this level only 2 times!
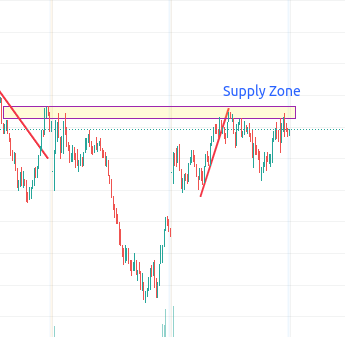
STRONG VS. WEAK SUPPLY ZONE Vs.STRONG VS. WEAK SUPPLY ZONE
As you can see from the two examples above, we have a strong and a weak supply zone.
The first example on top is showing how supply is becoming weaker in time, since it has been touched 4 times and on the fifth there is a breakout to the upside.
The second example on the bottom is showing how supply is still holding strong and is pushing the price higher. Price has touched this level only 2 times!
TIMEFRAMES
Although all timeframes do presumably work with supply and demand zones, I do tend to stick to higher timeframes. I am mostly using Daily, 4H and 1H for more precise entry.
The lower timeframes do give more information, but I do tend to start my analysis from the higher timeframes. This has proven to protect the account from the casual daily swings and put emphasis on less but more reliable trades.
PRICE ACTION AND SUPPLY AND DEMAND ZONES
All things being equal, I do like to see a confirmation from price action. It is crucial to see price confirming those levels
and I do find price action great for entries and exits, as you will see later from my trading system.
BEAR/BULL TRAPS AND SUPPLY AND DEMAND ZONES
A very important role in finding entries play bear and bull traps.
Knowing how to use them is essential for the understanding of the trading strategy that I utilise with supply and demand zones. That is why I highly recommend that you come back to that part of the course and make sure you understand the psychology behind them, because they will be crucial for the trading strategy.
SUPPLY AND DEMAND ZONES AND INDICATORS
Unlike other supply and demand traders, I do not use any indicators. I like to see simple charts, because the more cluttered a chart is, the harder it is to take a decision.
I do tend to use support and resistance levels in conjunction with the above mentioned tools.
EXAMPLE DEMAND ZONES
As you can see from the screenshot above, there is a large demand area, which was tested once before price moved higher. There was a bearish rejection candle that formed on the first retracement, which was immediately followed by a bullish engulfing candle. After that re-test, price started a bullish trend.
EXAMPLE
large candles
SUPPLY ZONES
The supply zone above formed on the daily chart of . As you can see there were a couple of large candles before and after the
retest of the supply zone. They were giving us a visual confirmation of this zone. The place where most short-sellers trading off
the supply zone would have entered is marked by the bearish engulfing pattern.
This place shows you how important it is to know price action trading well, before you start using supply and demand zones.
EXAMPLE
large red candle re-test and entry
SUPPLY ZONES
The supply zone above is taken from crude oil’s daily chart. As you can see from the large red candle in the beginning of the formation of this zone, there was a visual confirmation of its place. Then we had a re- test of this zone and a bearish engulfing
pattern, which led to a very quick sell-off.
Two things are important here:
1) Patience for the right setup
2) Quick reaction
EXAMPLE below again
large candle
1st re-test
2nd re-test
and then entry
DEMAND ZONES
Here is another example from . It is again a confirmation that supply and demand zones are a universal tool that could be used with different instruments and different timeframes. You can see the large green candles that formed around this zone. This gives us a very good visual confirmation that the demand zone is around. Then there was an inside bar, which gave green light to a large number of buyers
EXAMPLE
large candle
DEMAND ZONES
Here is another example. You can see a well-established demand zone that was first re-tested a long time after it first formed, but it did work great. This is another proof that for supply and demand zones there is no expiration date, so to
speak. The demand zone is also
EXAMPLE
price falls below demand
DEMAND ZONES
As you can see from the example above, supply and demand principles apply to the world of stocks, too.
After price falls below the demand zone and after the first sign of a reversal (bullish engulfing), you can see crowds of buyers pushing the price higher.
EXAMPLE
price breaks above the supply zone
SUPPLY ZONES
Here is another example from the Indian stock market. It shows another example from another industry and again the same powerful characteristics of the supply zone.
As you can see the price tries to break above the supply zone and then quickly buyers are losing interest. That leads to a major price continuation of the downtrend and around 20% decrease in value.
We have now reached to last part of this tutorial on Rules to be careful around trading Supply Demand.