
Table of Contents
Trading with volume profile POC as support and resistance
This method to find High Probability Support and Resistance Levels from volume.
The ideas of trading with support and resistance levels are very vastly used. chart patterns and predicting where price action is taking place and then taking them into which direction is very important. Favourable trades are best place where we have favourable Risk and reward ratios which is very easy at support and resistance.
How to do actually find a strong POC?
The first step on what we look for is a strong uptrend or downtrend that is with very good momentum. we can see one identified in the rectangle on the chart below. There is strong volume here with little consolidation so this would be an ideal candidate of a strong downtrend we need.
An example of a strong trend on stock below in downtrend
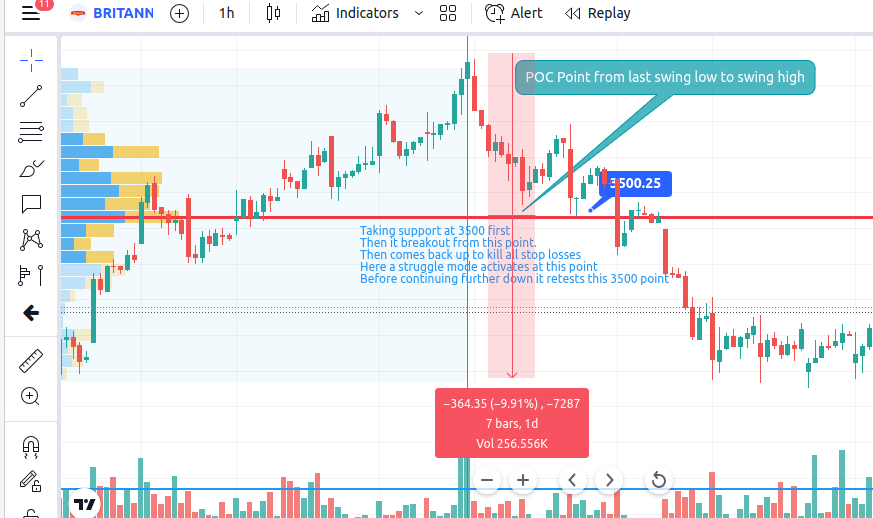
Next, we draw the fixed range volume profile from the start of the uptrend to the end of the uptrend, as shown above. The point of control (POC) for the profile is the support/resistance level we are interested in.
Why this POC acts as support/resistance now when marked from strong uptrend/downtrend before?
POC represents the price where the most volume occurred during the trend. Since the trend we are looking at is a downtrend or a uptrend, it’s safe to assume that if price comes back to this point sellers in downtrend and buyers in uptrend will take over again and drive the price back down in downtrend making it resistance and upwards in uptrend, thus making this a support.
Now if we talk of uptrend POC, In the case of the support, this level would be where buyers step in and drive the price back up. We can see that the level we found being a resistance is supported on the chart when price comes back to test this resistance level, it is rejected and sent downward.
An example of using a volume profile to find a resistance level:
The power of this strategy can be seen here, if we were to enter short when price on then below would be very profitable trade.
What happens if the level fails?
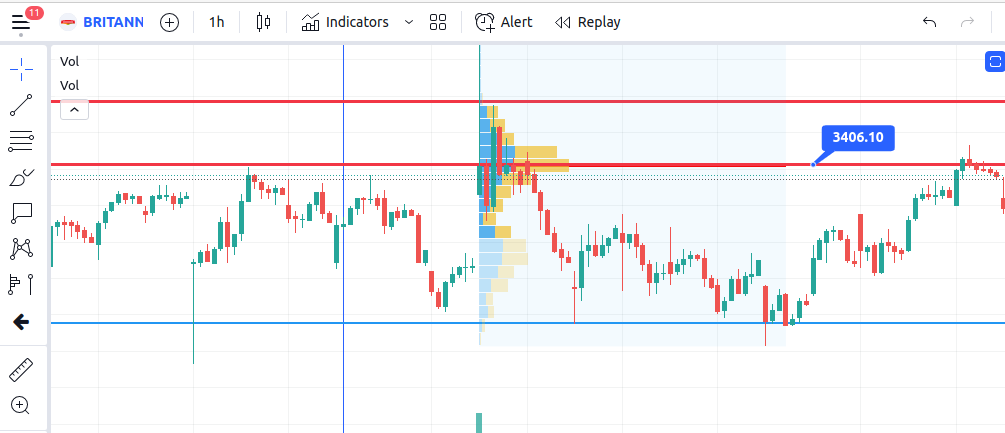
We all know nothing is certain in this world mainly in trading, support and resistance levels fail sometimes due to many factors lime market conditions or sudden news breakout. Now what can we do? Well more often than not, if one of these levels fail, a polarity swap occurs. A polarity swap is when a support becomes a resistance or vice versa.
Lets take an example trend based support:
Now lets talk about example of a support level failing and a polarity swap occurring
We used the POC from the uptrend to create a support. Price then breaks through this support level and heads downward. That means that this level is officially invalided it as a support and a polarity swap has most likely occurred, turning this support into a resistance level. When price comes back to this level we see that it is rejected, thus confirming that the swap has occurred and this is a new resistance point we should watch.
We increase the probability of the Support/Resistance levels working using confluence with other indicators or levels and also psychology levels like round figures like 3500 below.
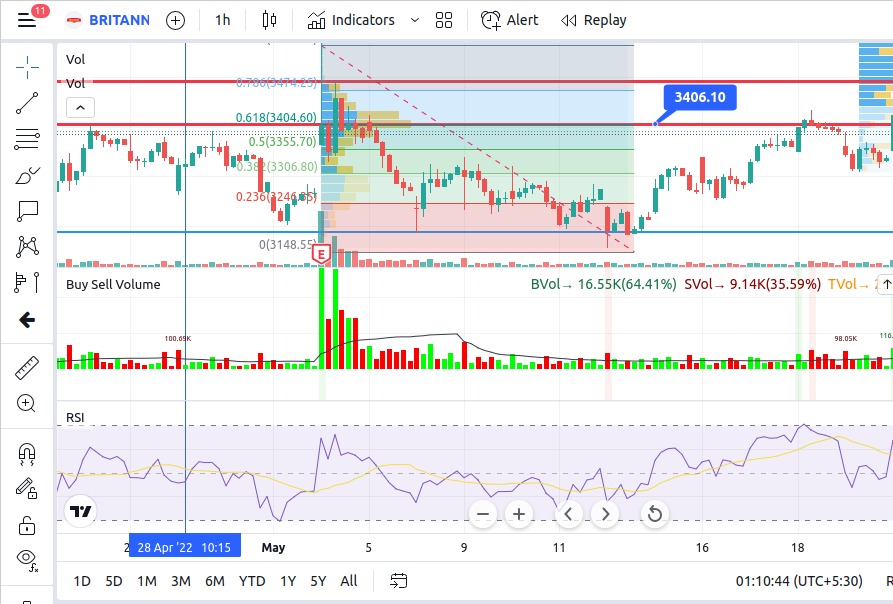
Example of double confirmation with other indicators like RSI, Fibonacci:
When we find a trend based support. We then draw a Fibonacci Retracement and find that this support has confluence with the .618 level. This makes it much more probable that a reversal would occur here. If not Fibonacci levels so you could use anything to confirm these levels I.E RSI oversold, VWAP, divergences, etc. Normally we can use Fibonacci levels and divergences at these levels to look for confluence and confirm the trades. Below the poc is lined up wtih Fibonacci levels and the price respected it by treating it as resistance then again retest it. Then again breakout upwards and again retest before going up again.(struggle mode activated). RSI is not overbought and thus continues its rally upwards.
Trading strategy
Everyone must of hear of volume profile but using POC level/levels as the Support/Resistance zones to trade is explained here
- Identify a strong trend with good volume and little consolidation
- Draw a fixed range volume profile from the start of the trend to the end of the trend
- Look for the POC and draw a line indicating it as a Support/Resistance
- Wait for price to return to this Support/Resistance line
- Look for confluence with other levels or indicators
- Enter a short or long trade depending on the Support or Resistance, with a good stop loss
- If price breaks out from the line and triggers stop assume a polarity swap has occurred
- Wait for price to return to the level and look for confluence
- Enter a trade in the opposite direction of the original trade (i.e. if the original trade was long when price returns back to this level you would short)
Conclusion
Hope that here in this article you could see the power of volume profiles and gave you a way to utilise them in your setups. This article is purely for educational purposes, I am not a financial advisor.
Thank you for reading, please share to help others find it….