
Table of Contents
Checklist for Option trading for Nifty BankNifty
1.Check Sensibull for Option chain data for major Resistance and Support
Below you can see more big red bars compared to green bars. The red bars on Call side(left side) are various resistances formed. From sellers perspective Calls selling has more OI which means Sellers are betting than index is not going up tomorrow beyond these resistances which are 17100,17200,17300 and 17500. They are also strong on markets not falling beyond 16500 support.
https://web.sensibull.com/option-chain/?expiry=2021-12-30&tradingsymbol=NIFTY

2. Check for Option chain data on NSE Site for PCR Ratio
https://www.nseindia.com/option-chain
Check PCR Ratio in Nifty option chain on weekly expiry


In above pcr ratio is 12,79,526/14,70,186= 0.87 which is below 1 slightly which is moderately bearish
Put Call Ratio (PCR)?
PCR is the ratio of all the Puts/Calls traded every day. If the ratio is more than 1, it means that more puts have traded during the day and if it is less than 1 it means more calls traded during the day.
To trade based on PCR first we will first need to collect historic PCR to know the extreme ends it can reach.
a. If PCR is below 1, it would mean that more calls are being traded and since more calls are being traded by the retail traders (option buyers) this could mean that the markets might do the opposite which is go down. Lower than 1 the PCR is, higher the chances of the market coming down.
b. If PCR is above 1, it would mean that more puts are being traded and since more puts are being traded by the retail traders (option buyers) this could mean that markets might do the opposite which is go up. Higher than 1 the PCR is, higher the chances of the market going up.
Now historically or previous PCR range is noted if it is crossing that range than its believed to go up or down. Say if historical is in range of 0.8 to 1.2, at 1.2 PCR the chances of market going up will be the highest.
https://www.indiainfoline.com/markets/derivatives/put-call-ratio
For BankNifty is 0.80 PCR Ratio for OI Data which is also less than 1 slightly, so moderately bearish
If the ratio is high in a falling market, it reflects how bearish the sentiment is. But a rise in the ratio in a rising market is considered a bullish signal.
3. Check SGX Nifty to get a idea of market sentiment
Check to see if SGX Nifty has been bullish, bearish, range bound etc.
4. Check the view on futures data
https://www.indiainfoline.com/markets/derivatives/futures

here long unwinding means sellers are exiting the long positions which means they are anticipating a up move.
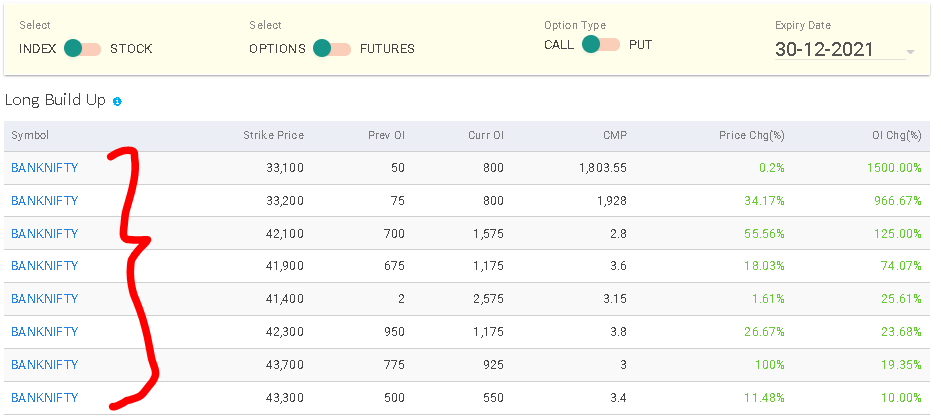
5. Check the build up data for a overview
https://www.indiainfoline.com/markets/derivatives/long-buildup
for banknifty long built up is showing for below strikes
6. Check major indexes for positive or negative sentiments in market
Mainly major indexes, asian indexes, american indexes etc..
https://www.moneycontrol.com/markets/global-indices/
https://www.indiainfoline.com/markets/global-indices/major-indices

7. Look for IV percentile or IVP for going sell or buy
IV percentile (IVP) is a relative measure of Implied Volatility that compares current IV of a stock to its own Implied Volatility in the past. Put simply, IVP tells you the percentage of time that the IV in the past has been lower than current IV. It is a percentile number, so it varies between 0 and 100. A high IVP number, typically above 80, says that IV is high, and a low IVP, typically below 20, says that IV is low.
High IVP go for sell side like bull pull spread or bear call spread instead of bull call spread or bear put spread. Basically net credit strategies rather than net debit strategies.
Here any IV drop can benefit the sellers by premium values falling very quickly.
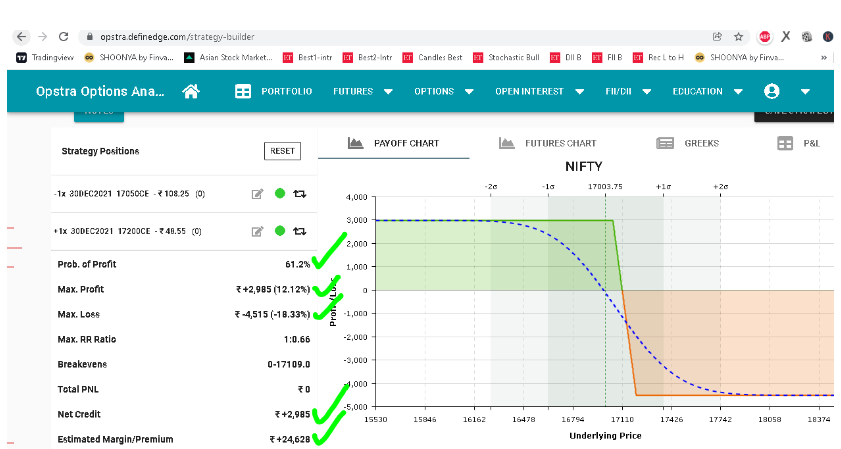
https://opstra.definedge.com/strategy-builder

Opstra Strategy Builder8. Use the strategy builder to check POP, Max profit, Max loss etc…
9.How to make a Trade on Options based on Trading day
Highest decay in Option premiums happen closer to the expiry.
For weekly options
- On Start of weekly options say Friday and Monday you can look for buy strategies with limited risk and limited reward using the Option strategies like Bull Call spread etc.. based on market outlook. Or even long iron condor if you anticipate a huge movement on any side. Long straddle and Long straddle can also be used.
- On Towards end of Week that is Wednesday and Thursdays, time decay is on your side if you are going for Selling side. That said its better to go with limited risk and limited reward trading strategies like short iron condor, short iron butterfly.
- Tuesdays in morning parts can be opted for buying strategies and towards end if needed only Sell side strategies.
Theta decay is less on Friday and Monday are good opportunities to be on buy side like Bull call spreads or Bear Put spreads with limited profit and limited loss. Here the risk is defined.
With time decay aggressive towards weekend its better for Sell side strategies like short iron condor or short iron butterfly to gain from theta decay which can even compensate for any Delta loss due to price movements.