Banknifty Nifty Vwap with Previous day Vwap strategy simple

Banknifty Nifty Vwap strategy simple
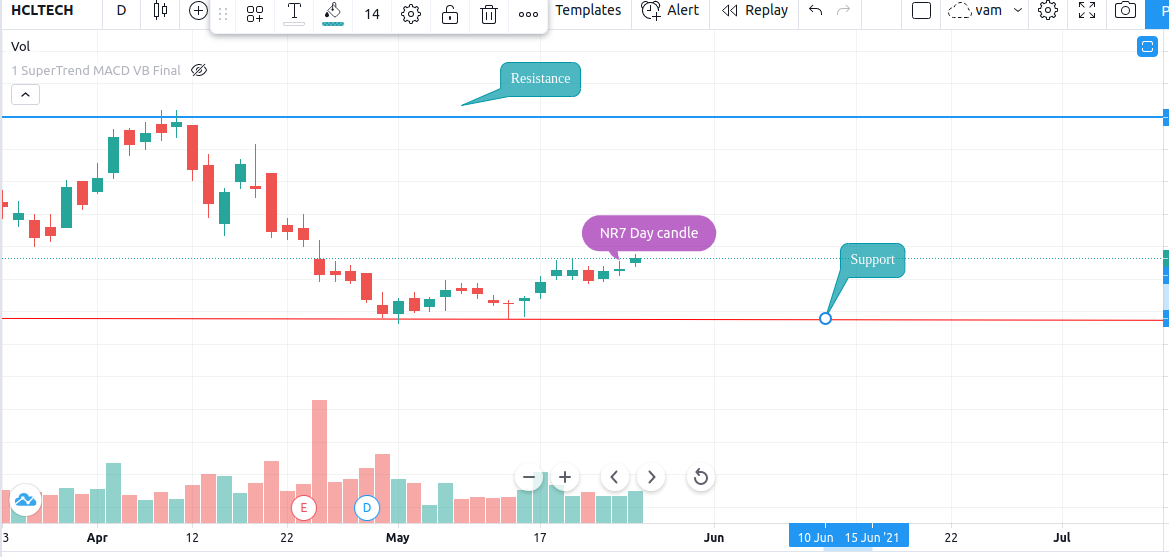
One of the strategy for VWAP for Banknifty and Nifty is to consider the closing of previous day VWAP on Banknifty/Nifty Futures Chart. Now let’s Draw a horizontal line which will be indicated as PVWAP or Previous Day VWAP. Now on the current day chart VWAP indicator is added when the price breaks through PVWAP line with relatively higher than average volume say atleast 40k on 3 min candle of Banknifty , you can go long or short.
For safer traders, you can always wait for price to pullback to PVWAP and check for rejection like long wicks. Once you spot it, you can go long/short accordingly.
Now the gap between PVWAP and CVWAP(current VWAP) … Read the rest